
Market Sentiments: S&P 500's Approaching 200-Day Moving Average
X LINE TRADING
4/19/20255 min read
S&P 500 Nears 200-Day Moving Average Again, Recalling 2020 Dip
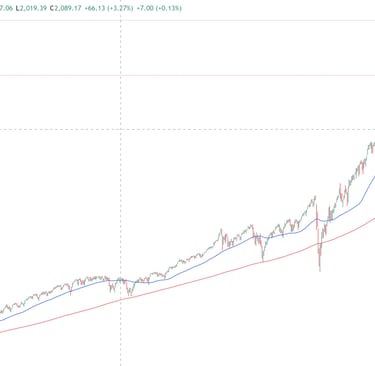
In the wake of the COVID-19 pandemic, the S&P 500 experienced a dramatic decline in early 2020. Beginning in March, the index fell below its 200-day moving average, a crucial indicator of long-term market trends, marking a significant shift in market sentiment. This period was characterized by rapid fluctuations and widespread uncertainty. As investors grappled with the implications of lockdowns and economic slowdown, the market witnessed an extended duration below this critical threshold, reflecting a bearish sentiment that prevailed during this time.
The S&P 500 remained below its 200-day moving average for several weeks, signaling a retreat in investor confidence. Economic factors, including soaring unemployment rates and plummeting consumer spending, contributed to the negative outlook. The abrupt halt of economic activities led to fears of a recession, with many sectors suffering severe losses. Consequently, investor sentiment turned cautious as the implications of the pandemic unfolded worldwide.
This bearish trend was particularly pronounced during March 2020, when the S&P 500 recorded its worst single-day drop since the 1987 market crash, further deepening the fear that gripped the financial markets. Throughout April, although volatility persisted, there were signs of recovery as stimulus measures from governments and central banks were introduced to stabilize economies. However, the time spent below the 200-day moving average during this period serves as a historical marker, illustrating how rapidly market conditions can deteriorate and highlighting the significance of investor sentiment in shaping market trajectories.
Understanding this historical context is essential for contemporary analysis. By examining the S&P 500's previous behavior in 2020, investors can better gauge the current market environment and potentially draw parallels with today’s market sentiment as it approaches the same moving average. This insight into past performance can enhance strategic decision-making in the face of evolving market conditions.
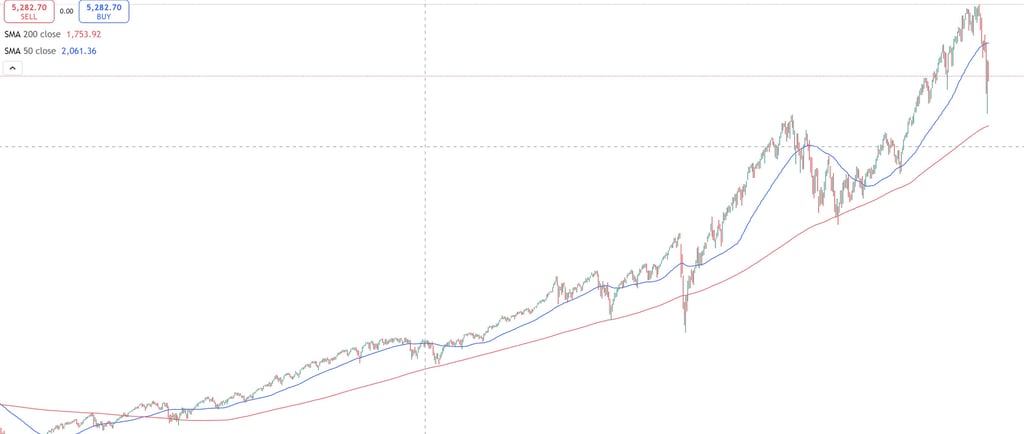
Current Market Trends: Approaching the 200-Day Moving Average
The S&P 500, a benchmark index that reflects the performance of 500 of the largest publicly traded companies in the United States, is currently nearing its 200-day moving average. This significant technical indicator has historically been utilized by traders and investors to gauge market momentum and potential reversal points. As the index approaches this crucial threshold, it brings to light various market trends and economic factors that may influence its trajectory.
Recent trends indicate a volatile market environment characterized by fluctuations driven by economic events, policy changes, and global tensions. For instance, in 2020, the S&P 500 experienced a sharp downturn due to the onset of the COVID-19 pandemic, followed by an unprecedented recovery. Comparatively, current trends suggest a mix of optimism and caution among investors. This cautious sentiment stems from persistent inflationary pressures, rising interest rates, and ongoing geopolitical uncertainties, which collectively contribute to heightened volatility.
Key indicators, such as employment rates and consumer confidence, further complicate the current market scenario. While job growth remains robust, concerns over wage inflation may prompt the Federal Reserve to adjust its monetary policy, thereby influencing market dynamics. Additionally, investor sentiment, shaped by these economic indicators, plays a crucial role in determining the likelihood of the S&P 500 maintaining its upward trajectory as it approaches the 200-day moving average.
In conclusion, the S&P 500’s approach to the 200-day moving average serves as an essential focal point for market participants. By analyzing current trends, key economic indicators, and historical parallels, investors can better navigate their decision-making processes in this evolving economic landscape. Understanding these elements is crucial for discerning whether the current market conditions mirror those of 2020 or reflect an entirely different trajectory moving forward.
Investor Sentiment: Perception and Implications
Investor sentiment plays a pivotal role in shaping market dynamics, particularly as the S&P 500 approaches its 200-day moving average. This technical indicator serves as a barometer for market health, influencing how investors perceive potential market movements. When the index nears this critical threshold, it often signals a moment of heightened psychological activity among traders. Many investors consider the 200-day moving average a key trend line, prompting various trading strategies aimed at capitalizing on potential price reversals or continuations.
As the S&P 500 approaches this moving average, sentiments can oscillate between optimism and pessimism. For instance, bullish investors may perceive the nearing moving average as an opportunity for growth, prompting increased buying activity. Conversely, bearish investors might view this proximity as a signal to sell off assets, fearing a downward trend. Historical data supports these sentiments; similar market conditions have often resulted in significant price movements, capturing the attention of both retail and institutional investors.
The psychological factors at play during these moments cannot be overlooked. Investors may fall prey to cognitive biases, leading to herd behavior where sentiment, rather than fundamentals, drives decisions. Such collective emotions can amplify market volatility, heightening the importance of understanding sentiment analysis when formulating trading strategies. Furthermore, the implications of investor sentiment extend beyond just immediate trading decisions; they can shape long-term investment strategies as well.
By analyzing historical responses during comparable market scenarios, one can glean valuable insights into how sentiment impacts trading decisions. Recognizing these patterns allows investors to position themselves strategically, aligning their expectations with prevailing market sentiment as the S&P 500 nears its 200-day moving average. Ultimately, understanding this intricate relationship is essential for making informed investment choices.
Looking Forward: Predictions and Strategies
As the S&P 500 approaches its 200-day moving average, market participants are keenly analyzing various indicators to forecast future price movement. Historically, this key technical level has often acted as a support or resistance area, depending on the prevailing market conditions. When the index rises above this moving average, it may signal renewed bullish momentum, while a failure to maintain above it could indicate a bearish reversal. Current data suggests a cautious optimism among investors, but volatility remains a significant concern.
In the coming weeks, several factors may influence the S&P 500’s trajectory. Economic indicators such as employment rates, inflation data, and consumer sentiment will play crucial roles in shaping market sentiment. Alongside these fundamental factors, technical analysis will be vital in assessing the potential for trend reversals or continuations. Investors should also pay attention to global events, as geopolitical tensions or changes in fiscal policy can affect market stability.
In navigating this critical juncture, investors are advised to adopt a multi-faceted strategy. Diversification remains a sound principle; maintaining a balanced portfolio can help mitigate risks associated with sudden market shifts. Investors should also consider employing stop-loss orders, which can provide a safety net during periods of high volatility. Analyzing historical trends related to the 200-day moving average could offer additional insights into potential market behavior, helping investors make informed decisions.
Furthermore, investors should stay updated with economic reports and expert analyses, which may provide clarity on upcoming movements within the index. Flexibility will be key, as market conditions can change rapidly, and being prepared to adapt strategies will serve investors well. Overall, the S&P 500's approach towards the 200-day moving average presents both challenges and opportunities for investors keen on understanding market dynamics.
As the S&P 500 approaches the 200-day moving average once again, recalling the significant market dynamics encountered since March 2020, it raises questions among investors and analysts alike. The pandemic-induced volatility marked a pivotal moment, leading to rapid adjustments in market strategies and investor sentiments. Observing this convergence with the 200-day moving average can provide crucial insights into potential market trends and direction. Market participants are keen to monitor how this interaction unfolds, as it often serves as a key indicator for both bullish and bearish trends. The historical significance of this moving average may act as a psychological barrier or support level, influencing decisions and trading behaviors across the board. In this context, the S&P 500's performance could signal broader economic implications and set the tone for future market movements.